|
The All Integrated Management
Console
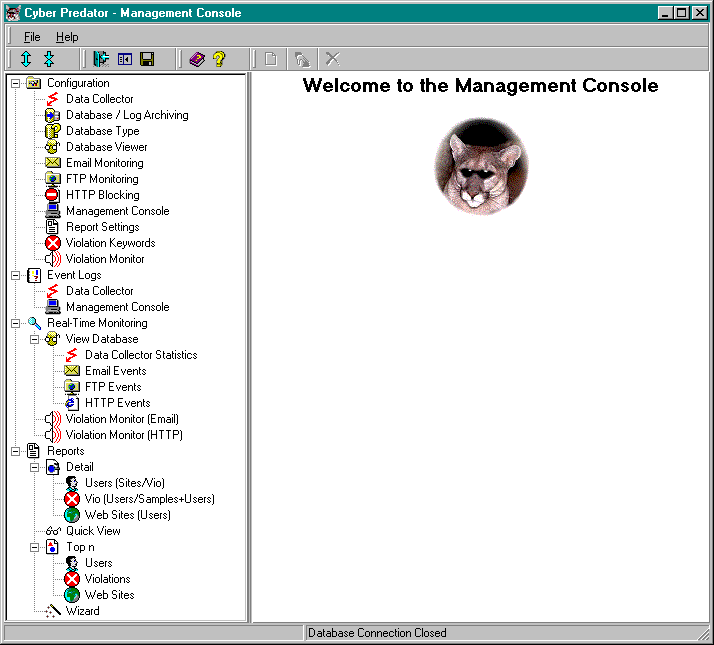
Here are some samples of the Real-Time Violation Monitor;-
The Real-Time Violation Monitor function is available as part of the
Management Console or via a separate stand alone program which is included with
your download.
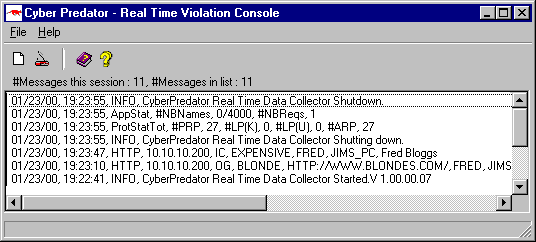
The most recent events are at the top of the screen.
In this scenario, the Real-time data collector was started at
19:22:41.
a user called FRED using Jim's PC, made an outgoing request to www.blondes.com,
and the request has been picked up, in the text coming back to the browser 37 seconds
later is the word EXPENSIVE which was also picked up.
At 19:23:55 the Real-time data collector was shut down, and displays its session
statistics for you to see.
As well as displaying the data in the Violation Monitor,
this information is also recorded to the database and can be reported
against.
Quick View
Users activity can be seen at a glance, sorted under 3 categories,
UserName, Web Site and IP Address, the data is collated in a collapsible tree, just like
explorer, and can be sorted into different orders using the radio buttons at the bottom of
each screen:-

Here we can see FRED has visited 6 sites 13 times, and spent 220
seconds viewing these sites, JOE has visited 1 site 4 times and spent 86 seconds viewing
it, lets expand the tree:-
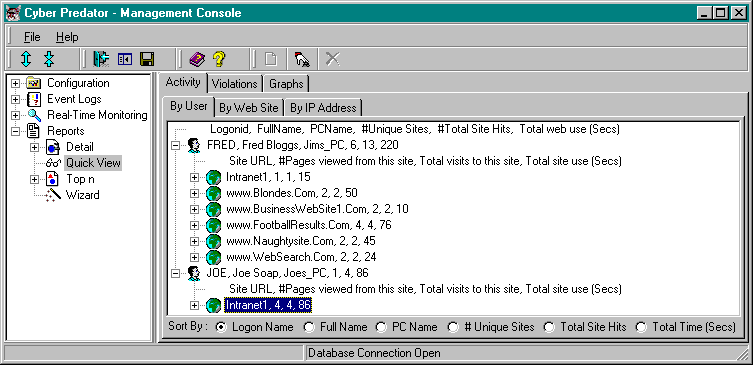
Here we can see the sites the users have visited, and the number of
pages at each site that have been viewed, 1, 2, 2, 4, 2, 2 and 4 respectively, notice the
number of times each site has been hit, and the number of seconds spent at each site, lets
expand again:-
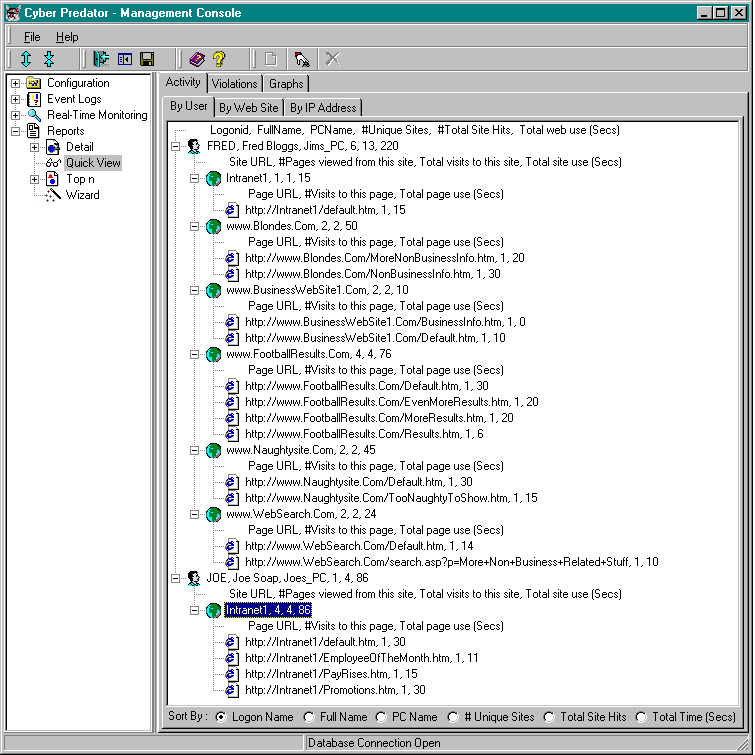
Here we can see the actual pages visited, how many times, and how
long spent at each page on the site, and near the bottom you can see data that has been
entered into a web search engine, "More+Non+Business+Related+Stuff" so you can
even see what people are searching for as well as what they are looking at.
OK, activity by site:-
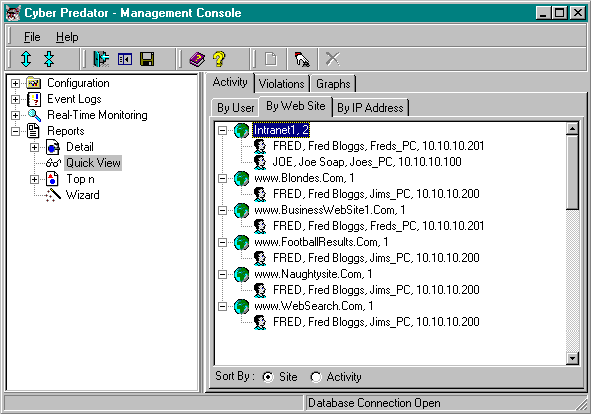
Shows, web sites and the people that visited them, see how Fred used
his own PC to visit the OK sites, but sneaked onto Jim's PC, to look at the naughty sites,
Cyber Predator picked him up.
The Activity by IP tab, this shows activity by IP address, people
not using Microsoft Windows™ would use this tab to tie activity to a terminal, others
can too.
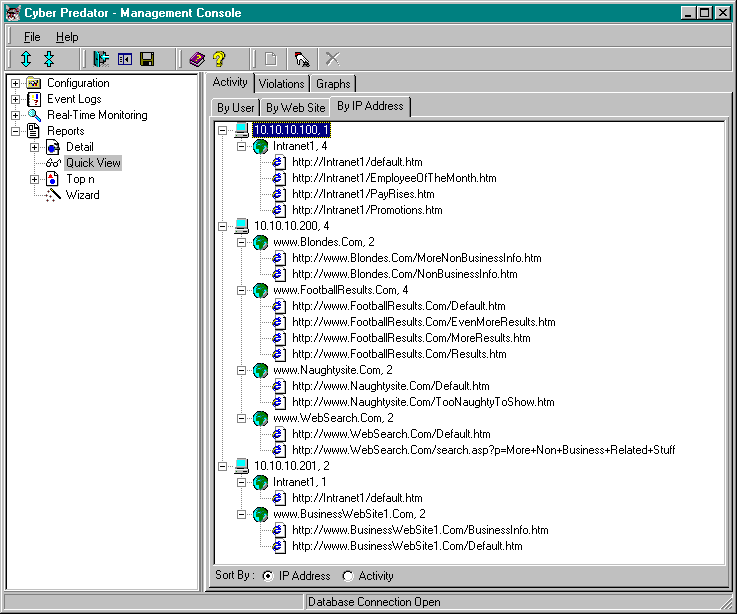
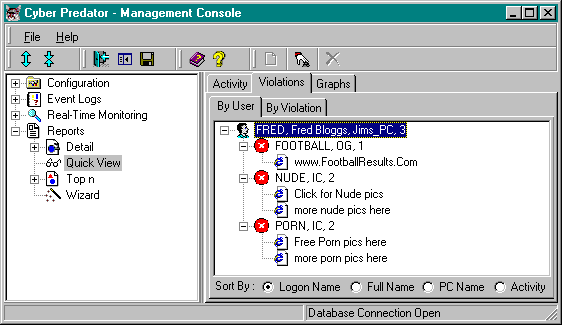
Violations
Each violation is logged as IC for incoming or OG for outgoing, the
screen below shows the violation word, the direction, and the number of times (per user)
this word has been detected. In the case of OG violations the system gives you the URL of
the target site, for IC violations, you are shown a sample of data surrounding the
violation word, so you can see what context that word was used in, sometimes some
violation words can actually be OK in certain contexts:-
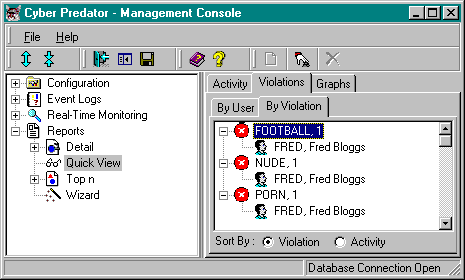
Sorted by Violation too, you can see all users that are associated
with that word
Graphs
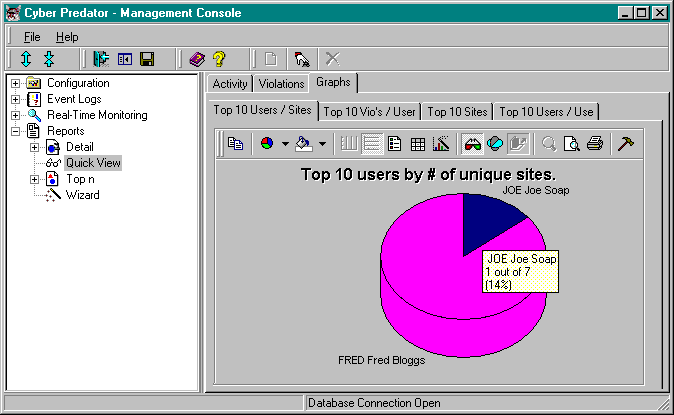
There are 4 graphs, the first one shows top 10 users by # of unique
sites, by hovering the mouse over a segment you get a detail box popping up, there are 20
different types of graph you can choose from, we have selected some different ones here to
show you some of them:-
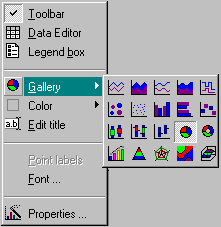
By clicking the right mouse button over any graph will show you a
menu, from here or the toolbar, you can choose different graph types, colour schemes,
fonts, etc etc:-
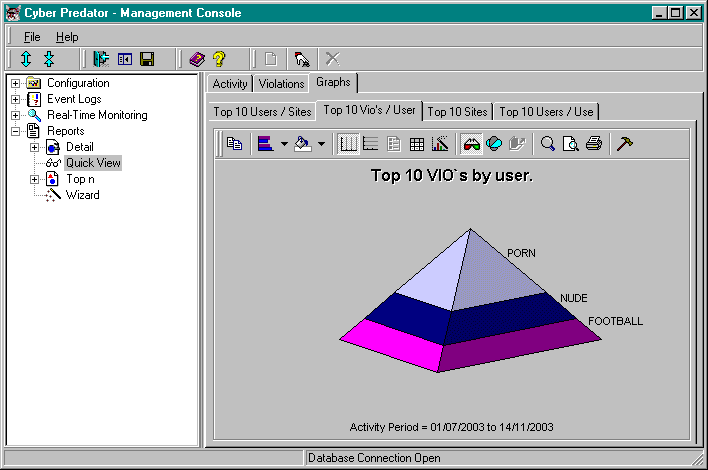
This Graph shows you the user with most violation words:-
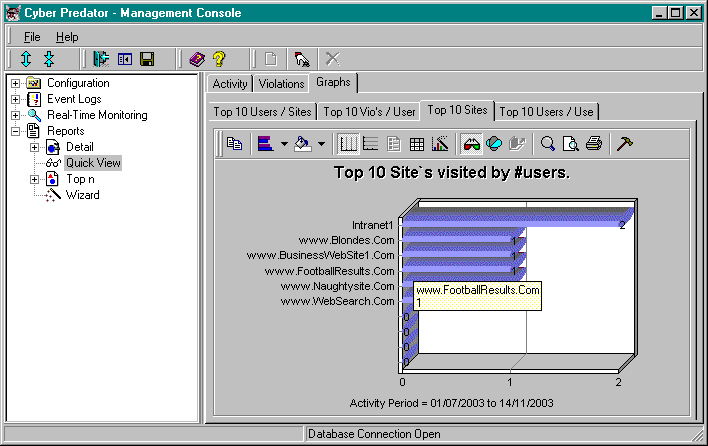
Top 10 sites, speaks for itself;-
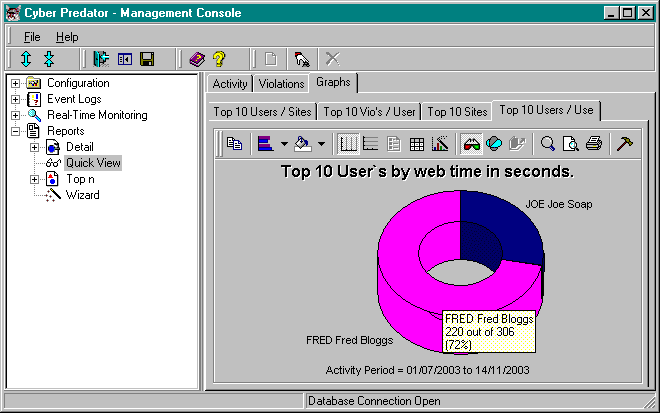
The top 10 users graph, similar to the first graph, except this one
shows time usage rather than number of sites visited, the sample below is a doughnut graph
showing Fred with 220 seconds of usage out of a daily total of 306:-
Obviously this data is made up, and the web site names are
fictitious, but hopefully this gives you a view of what Cyber Predator can do for you.
|